About the Homelessness Monitor

The Homelessness Monitor is a longitudinal study, commissioned by Crisis and is funded by Crisis and the Joseph Rowntree Foundation, providing an independent analysis of the homelessness impacts of recent economic and policy developments in the United Kingdom. It considers both the consequences of the post-2007 economic and housing market recession, and the subsequent recovery, and also the impact of policy changes. 

The first English monitor was released in 2011 and the subsequent reports document the change in homelessness trends since this baseline data was undertaken in England, Scotland, Wales and Northern Ireland. Statutory homelessness policy has diverged significantly across the UK since devolution in 1999 and is a contributing factor in explaining the variation in the levels and patterns of homelessness. 

A wide definition of homelessness is adopted in the Homelessness Monitor, and considers the impacts of relevant policy and economic changes on all of the following homeless groups: 

  • People sleeping rough. 
  • Single homeless people living in hostels, shelters and temporary supported accommodation. 
  • Statutorily homeless households – households who seek housing assistance from local authorities on grounds of being currently or imminently without accommodation. 
  • ‘Hidden homeless’ households – people who may be considered homeless but whose situation is not ‘visible’ either on the streets or in official statistics 

The series uses four main research methods: 

  1. Review of literature, legal and policy documents   
  2. Annual interviews with key informants from statutory and voluntary sectors 
  3. Statistical analysis on a) economic and social trends, particularly post-2007; and b) trends in the four homeless groups 
  4. Online survey of local authorities  

The research is carried out by Suzanne Fitzpatrick, Glen Bramley, Beth Watts and jenny Wood at Heriot-Watt University, Steve Wilcox former professor at the University of York, and Hal Pawson at the University of New South Wales. 

Homelessness in England

The Homelessness Monitor is a longitudinal study, commissioned and funded by Crisis, providing an independent analysis of the homelessness impacts of recent economic and policy developments in the United Kingdom. It considers both the consequences of the post-2007 economic and housing market recession, and the subsequent recovery, and also the impact of policy changes.

The first English monitor was released in 2011 and these pages document the change in homelessness trends since this baseline data was undertaken in England, Scotland, Wales and Northern Ireland. Statutory homelessness policy has diverged significantly across the UK since devolution in 1999 and is a contributing factor in explaining the variation in the levels and patterns of homelessness.

The research is carried out by Suzanne Fitzpatrick, Glen Bramley and Beth Watts at Heriot-Watt University, Steve Wilcox former professor at the University of York, and Hal Pawson at the University of New South Wales.

The following data is based on the latest published Homelessness Monitor in each country – England (2017), Wales (2015), Scotland (2015) and Northern Ireland (2016). For full research findings please download the monitor reports in the knowledge hub library.

Rough sleeping levels 

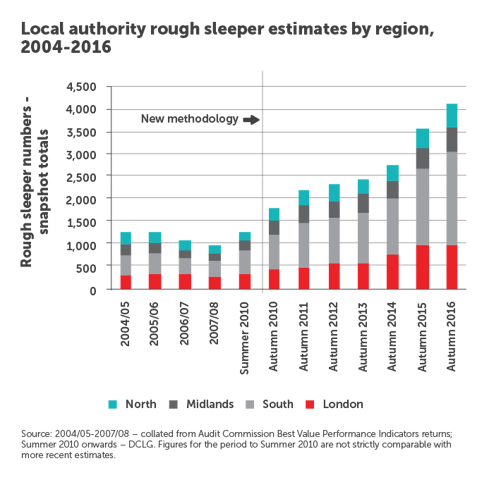
Rough sleeping levels in England have increased by 132% since 2010 and by 16% since 2015. The table below shows there are regional trends to these patterns. The levels of increase have been higher in the South of England at 166% and London at 132% since 2010.

In the past year there was a higher increase in rough sleeping levels outside of London at 21%, compared to only 3% in the capital.


These statistics are predominantly collected through estimates and even where actual street counts are undertaken they are an approximation of the true scale. The real figures are likely to be higher and are best regarded for the basis of trends rather than an absolute number.

Statutory homelessness levels

People who approach local authorities for homelessness assistance are entitled to an assessment to see if they are eligible for homelessness support. These assessments are to establish whether someone is ‘statutory homeless’ and dealt with under the provisions of the Housing Act 1996.

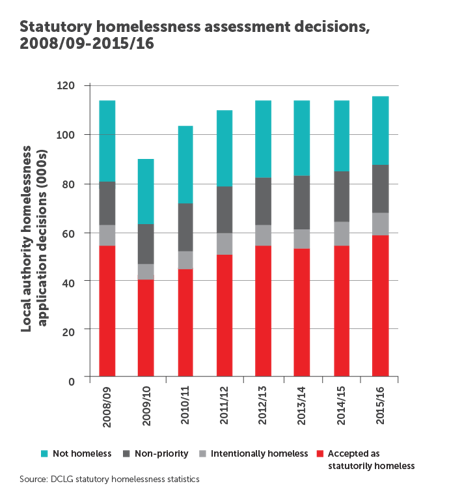
The table below gives a breakdown of the decisions made by local authorities. 58,000 households were accepted as homeless in 2015/16, a 34% increase since 2009/10 (assessed as unintentionally homeless and in priority need), with a 6% rise in the past year.

This only gives part of the picture of homelessness. Since a housing options approach was introduced in England more households have received homelessness prevention and relief assistance, see table below on homelessness prevention and relief.  

Causes of homelessness

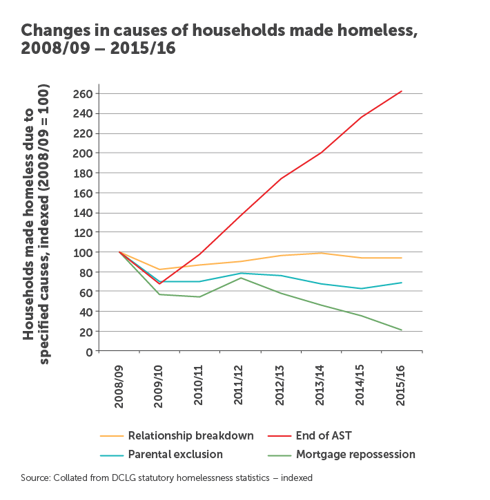
Official figures show the main cause of statutory homelessness is the ending of an assured shorthold tenancy (AST) which is the standard contract for people living in the private rented sector. The percentage of all acceptances caused by the ending of an AST was 11% in 2009/10 and now stands at 31% - a quadrupling of cases in this period.

The sharp increase shown in the graph below demonstrates the impact of the current rental market on homelessness and the impact of welfare reform changes. Homelessness attributed to mortgage arrears and repossessions has continued to fall in recent years and is at historically low levels at 1% of acceptances.

Parental exclusion and relationship breakdown have remained relatively stable. As above the statutory homelessness figures present only part of the picture. As people who aren’t accepted as homeless are not recorded there may be an under representation of homelessness due to rent arrears.

Homelessness prevention and relief 

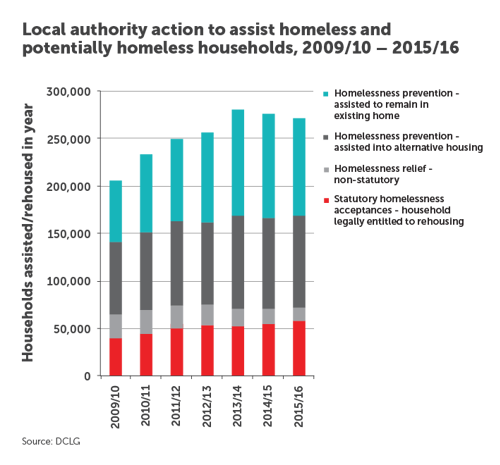
Homelessness prevention and relief refers to informal advice and assistance undertaken by local authorities outside of the statutory framework. Activities include help to find a private tenancy, debt advice or family mediation to resolve homelessness.

Combined with the statutory homelessness acceptances there were 271,000 local authority case actions to address homelessness in 2015/16. The graph below shows that this represents a 32% rise since 2009/10 with a slight decrease of 2% since the previous year for the second year running.

It is unlikely this drop in cases is due to a decrease in demand as two thirds of local authorities said that the overall flow of homelessness people had increased. Funding constraints and service capacity is most likely to explain why prevention and relief caseloads have decreased.

Hidden homelessness

Hidden homelessness refers to people who are considered homeless but whose situation is not visible either on the streets or in official statistics. This includes sofa surfers and people involuntarily sharing with others on a long term basis. 

Using household surveys, it is possible to build a picture of hidden homelessness in terms of concealed households, those sharing accommodation and overcrowded households. All of which remain heavily concentrated in London.

The above graph looks at potentially concealed households by tenancy. In 2016 the number of adults in concealed household units was estimated at 3.34 million which have increased by one third since 2008. 1.45% of households shared in 2016 and is most common for single person households. There is a higher concentration of sharing and concealed households in the private rented sector.

Housing demand and supply 

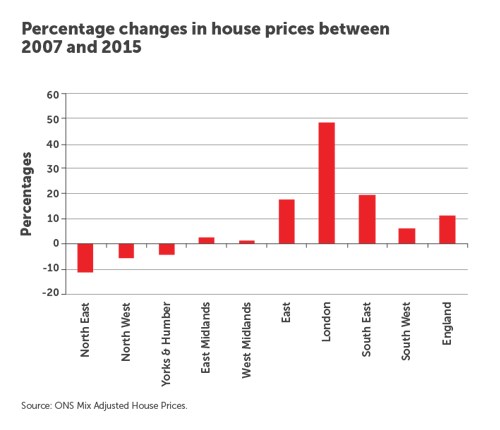
Average house prices in Britain have recovered unevenly since the crash in 2007. House prices in London have risen by 48% between 2007 and 2015. The graph below shows the changes to house prices since 2007. It shows that price rises in London and the South East and East have risen far more than the rest of England.

There still remains a shortfall in the levels of new housebuilding relative to household formation. Whilst there was a slight upturn in new housebuilding in 2015/16 new housing provision would still need to increase by a fifth to keep up with new household formation. Access to housing remains a large problem for homeless people.

Almost two thirds of local authorities said it was difficult to access social tenancies for homeless applicants due to shortage of social lettings in their area and housing associations being increasingly selective on tenants. 

Welfare policies

The shortage of affordable housing for low income households in parts of England continues to be intensified by welfare policy. The welfare changes introduced in this decade and those planned for the coming years will reduce the incomes of poor households by some £25 billion a year by 2020/21. These have more of an impact on particular groups of people.

In the 2016 survey local authorities reported that single people aged under 35 and large families were more difficult to house. The homelessness monitor series has found that welfare reform has been making both private landlords and housing associations more risk averse with regard to letting to households in receipt of benefits.


Homelessness in Wales

The Homelessness Monitor is a longitudinal study, commissioned by Crisis and is funded by Crisis and the Joseph Rowntree Foundation, providing an independent analysis of the homelessness impacts of recent economic and policy developments in the United Kingdom. It considers both the consequences of the post-2007 economic and housing market recession, and the subsequent recovery, and also the impact of policy changes.

The first English monitor was released in 2011 and these pages document the change in homelessness trends since this baseline data was undertaken in England, Scotland, Wales and Northern Ireland. Statutory homelessness policy has diverged significantly across the UK since devolution in 1999 and is a contributing factor in explaining the variation in the levels and patterns of homelessness.

The research is carried out by Suzanne Fitzpatrick, Glen Bramley and Beth Watts at Heriot-Watt University, Steve Wilcox former professor at the University of York, and Hal Pawson at the University of New South Wales.

The following data is based on the latest published Homelessness Monitor in each country – England (2017), Wales (2015), Scotland (2015) and Northern Ireland (2016). For full research findings please download the monitor reports in the knowledge hub library.

Rough sleeping levels

Rough sleeping in Wales has not been consistently monitored making it difficult to assess numbers and trends. National rough sleeper counts were undertaken in 2007, 2008, 2014, 2015 and 2016. The earlier counts recorded 138 and 124 rough sleepers with the largest concentration in Cardiff. A different methodology was used for the later counts which recorded 83 rough sleepers across Wales in 2014 on a single night and 244 over a two-week period in November.

The most recent count recorded 141 people rough sleeping on a single night in November and 313 people over a two week period in October. Data from 2016 cannot be compared to previous years due to differences in timing, methodology and coverage.

Statutory homelessness trends

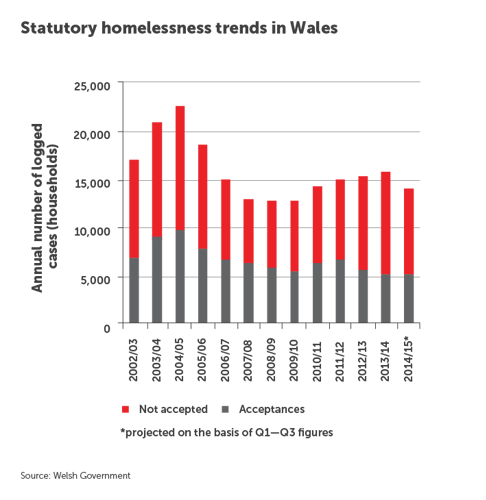
The Housing (Wales) Act 2014 introduced new duties to prevent and relieve homelessness which has altered the way homelessness statistics are recorded and measured. The graph below covers the period until 2014/15 until the new legislation and statistics were introduced. These will be updated when the new  Homelessness Monitor Wales is published in Summer 2017.

The graph above shows the number of applications assessed by local authorities rose by 23% between 2009/10 and 2013/14. However, in 2014/15 the number of households assessed dropped by 11%. This almost brought the figures back down to 2009/10 levels. The main explanation for this decrease is local authorities getting ready for the new prevention focused statutory system.  

Causes of homelessness

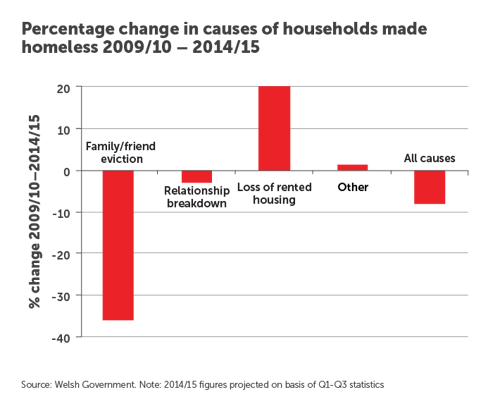
The graph below shows the change in the profile of homelessness causes over a five year period between 2009/10 and 2014/15. The loss of rented housing has increased by 20% over this period and is consistent with the picture in England. This is due to the rapid expansion of the private rented sector in Wales and the impacts of local housing allowance cuts which maybe reducing the resilience of low income households living there.

There has been a 35% decrease in evictions from family and friends and there is also a very small fraction of homelessness cases in Wales resulting from mortgage repossessions (2% overall).

Hidden homelessness

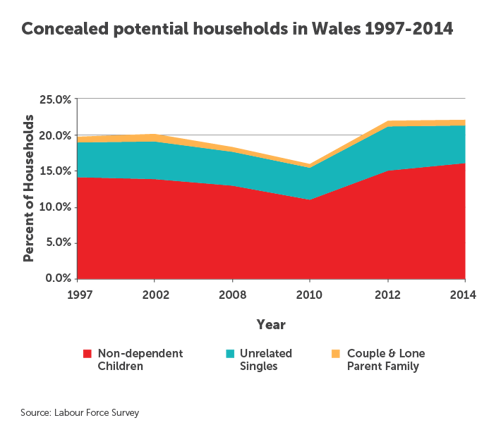
Hidden homelessness refers to people who are considered homeless but whose situation is not visible either on the streets or in official statistics. This includes sofa surfers and people involuntarily sharing with others on a long term basis.  Using household surveys, it is possible to build a picture of hidden homelessness in terms of concealed households, those sharing accommodation and overcrowded households. 

The graph above shows that in 2014 there were an estimated 134,000 households containing at least one concealed single household. The incidence of potential concealed households has been relatively stable in Wales, with a slight decline from 1997 to 2008, a rather sharper decline to 2010, then a pronounced rise in 2012 and a slight further rise in 2014.

After a long term decline, there has been a slight increase in the number of sharing households until 2014 in Wales. In 2014 there were about 14,500 households sharing in Wales (1.1% of all households) with higher levels in social housing.

Housing market affordability

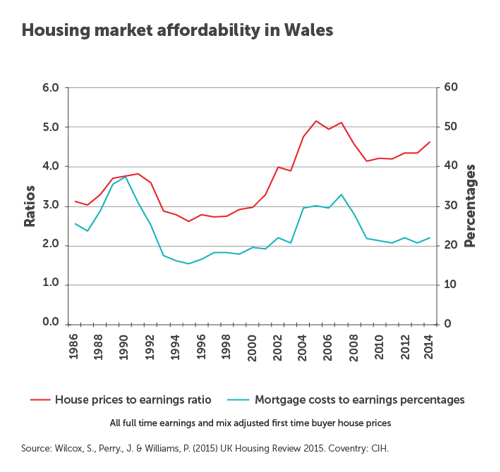
Housing affordability in Wales deteriorated from 1997 onwards and more sharply from 2007. As the graph below shows the combination of prolonged economic growth and low interest rates led to a sharp rise in house prices relative to earnings after 1997 but the impact on mortgage costs was less pronounced.

Whilst housing affordability has improved since 2007 access to home ownership has been more difficult for first time buyers in this period. The reduced flow of mortgage funds and regulatory pressures have contributed to this. The sharp reduction in the availability of low deposit mortgages

The sharp reduction in the availability of low deposit mortgages post 2007 has in effect created a ‘wealth barrier’ to home ownership for aspiring first time buyers. This is estimated to be excluding around 100,000 potential purchasers each year in the UK. 

Rapid growth of Private Rented Sector (PRS)

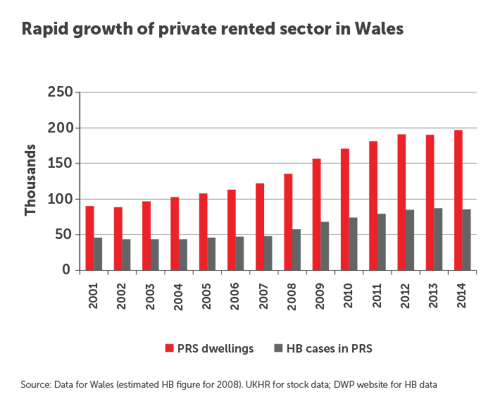
A consequence of the most recent housing market downturn is the rapid growth of the Private Rented Sector in Wales. The sector now plays an important and active role in providing accommodation for households at all income levels. This relatively new and important feature of the housing market lacks robust and timely data from which to fully understand its impact.   

The above graph shows the rise in the PRS overall and the associated increase in housing benefit claimants within the sector. In Wales in 2014 there were over 85,000 housing benefit claimants accounting for over 40% of all private tenants.  

Investment in affordable housing

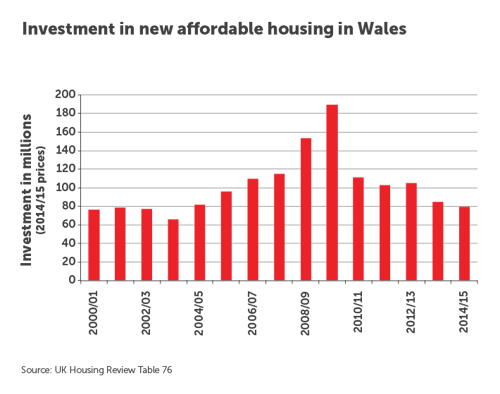
The Welsh Government has substantially increased investment in new affordable housing in 2008/2009 and 2009/2010, illustrated in the graph below. Since then the investment has fallen back to the relatively low levels of a decade earlier.

Despite this drop the Welsh Government appear to be on their way to meeting its target of providing 10,000 additional ‘affordable’ dwellings over its 4 year term. However, this falls short of the 5,000 ‘non market’ homes that need to be built every year.

Welfare policy

The welfare reforms introduced across Great Britain have a disproportionate impact in Wales which have five of the twenty most badly affected areas – Merthyr Tydfil, Blaenau Gwent, Neath Port Talbot, Rhondda Cynon Taff and Caerphilly. 

Lower local housing allowance (LHA) rates have slowed the growth in numbers of Housing Benefit claimants able to access the expanding private rented sector in Wales and increased average shortfalls between LHA and landlord rents. 

Homelessness in Scotland

The Homelessness Monitor is a longitudinal study, commissioned by Crisis and is funded by Crisis and the Joseph Rowntree Foundation, providing an independent analysis of the homelessness impacts of recent economic and policy developments in the United Kingdom. It considers both the consequences of the post-2007 economic and housing market recession, and the subsequent recovery, and also the impact of policy changes.

The first English monitor was released in 2011 and these pages document the change in homelessness trends since this baseline data was undertaken in England, Scotland, Wales and Northern Ireland. Statutory homelessness policy has diverged significantly across the UK since devolution in 1999 and is a contributing factor in explaining the variation in the levels and patterns of homelessness.

The research is carried out by Suzanne Fitzpatrick, Glen Bramley and Beth Watts at Heriot-Watt University, Steve Wilcox former professor at the University of York, and Hal Pawson at the University of New South Wales.

The following data is based on the latest published Homelessness Monitor in each country – England (2017), Wales (2015), Scotland (2015) and Northern Ireland (2016). For full research findings please download the monitor reports in the knowledge hub library.

Rough sleeping levels

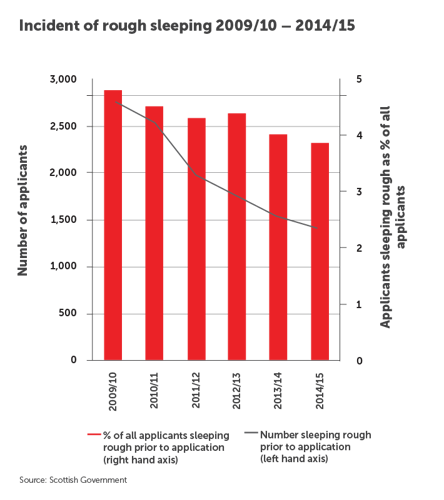
The Scottish Government maintains no regular rough sleeper ‘headcount’. Instead, the scale of rough sleeping can be gauged indirectly through the local authority homelessness recording system. This approach identifies rough sleepers as those who slept rough the night prior to approaching a local authority for support. 

The graph above shows 1,409 people applying as homeless in 2014/15 (4% of all applicants) reported having slept rough the night preceding their application. Over the past few years the number and proportion of applicants recorded as having slept rough immediately prior to a statutory homelessness application have fallen steadily, with the 2014/15 national total having almost halved since 2009/10 (down by 49%).

Evidence suggests that this approach greatly under represents the numbers of rough sleepers.

Statutory homelessness levels

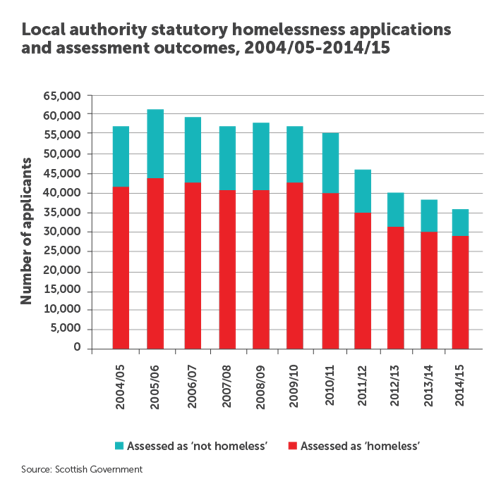
Homelessness trends in Scotland have reflected policy interventions more than housing market conditions. The overall scale of statutory homelessness peaked in Scotland in 2005/06 reflecting the early expansion of priority need and there has been a downward trend since 2010/11 as the graph below reflects. In 2014/15 Scottish local authorities logged 35,764 statutory homelessness applications, of which 28,615 were assessed as homeless. 

The fall in acceptances in Scotland are also the direct result of policy change in the form of the adoption of a Housing Options approach to homelessness prevention.  If formal homelessness applications are combined with approaches to Housing Options services annual levels of homelessness have remained relatively steady at around 54,000 households.

Causes of homelessness

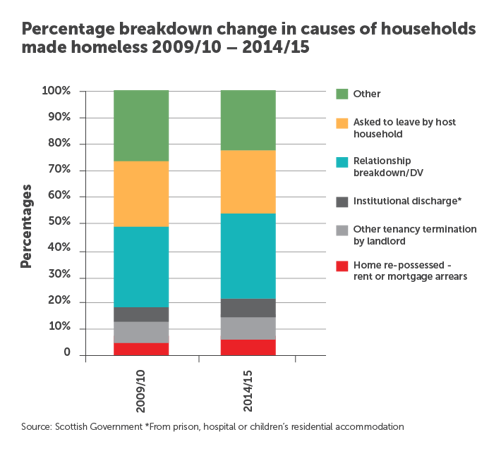
As the graph below shows, in the last 6 years there has been relatively little change in the reasons for statutory homelessness in Scotland. The main cause of homelessness is the loss of accommodation due to relationship breakdown or domestic violence at 32 per cent in 2014/15 and ‘family/friend evictions’ at 25 per cent. 

This is in contrast to England and Wales where the end of an assured shorthold tenancy or eviction from a tenancy have become the main cause of statutory homelessness. This may reflect the fact that Scotland’s housing market has been less pressurised than some areas of England and Wales.

Housing market affordability 

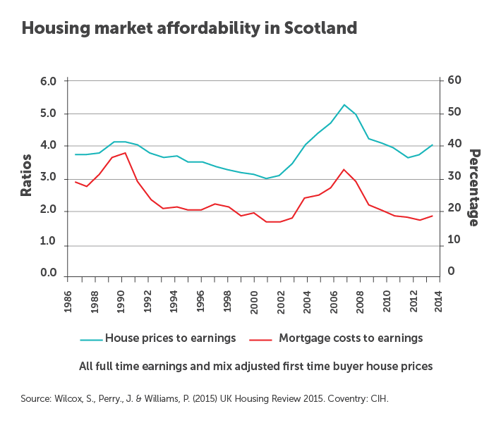
There have been continuing signs of housing market recovery in Scotland. Although as is the case in other parts of the UK house prices are a little lower than in 2007. As the graph below illustrates mortgage costs as a percentage of average earnings in 2014 are 40% down on 2007 levels.

However, house prices began to rise in 2013 and continue to in 2015. The supply of finances in the form of mortgages for those with limited deposit is more constrained than at any time in the last three decades. There are currently not enough new houses being built when compared with new household formation meaning prices are driven up for prospective homeowners. 

The supply of finances in the form of mortgages for those with limited deposit is more constrained than at any time in the last three decades. There are also currently not enough new houses being built when compared with new household formation meaning prices are driven up for prospective homeowners. 

Private rented sector

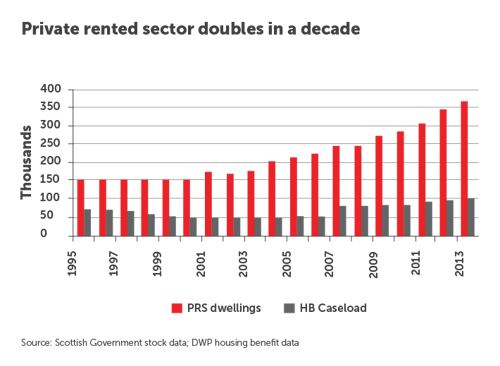
As with the rest of the UK, the private rented sector in Scotland has doubled between 2003 and 2013 as illustrated in the graph below. Growth is likely to continue but it is difficult to predict by how much because of the restrictions imposed on mortgage interest tax relief. 

Despite this growth the private rented sector still provides less than two thirds of the number of dwellings as the social rented sector. This is in contrast to England where the private sector is now much larger than the social rented sector. The majority of the PRS growth comes from properties that were previously owner occupied.

New supply of affordable housing

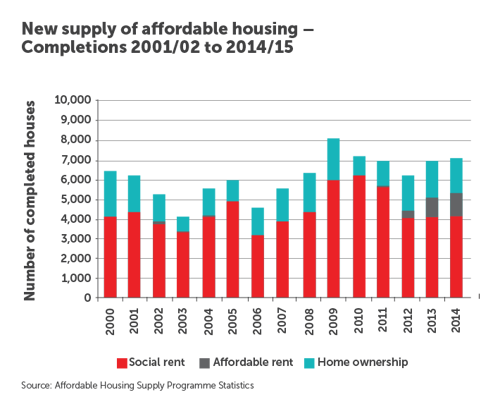
The Affordable Housing Supply programme (AHSP) has made a substantial contribution to overall new housing supply as well as to the supply of social and other forms of affordable housing. The budget for the programme is £463 million for 2015/16. The Scottish Government is on course to meet its target of providing 30,000 new affordable dwellings by 2015/16.

The graph above shows a considerable proportion of these new homes are for social rent but supply still remains a challenge with respect to addressing homelessness in Scotland. Housing supply fell to historically low levels during the recession and annual additions to the housing stock need to rise by 30% from 2013/14 levels just to keep pace with household growth.

Welfare policy

The Scottish Government, as part of the post referendum constitutional settlement, is to be provided with some limited new powers on the operation of welfare policies in Scotland. They have stated that these will be used for the effective ‘abolition’ of the ‘social sector Housing Benefit size criteria’ (commonly known as the ‘Bedroom Tax’) in Scotland, and the continuation of direct payments to social landlords of Universal Credit elements related to rental costs. 

The Shared Accommodation Rate of Housing Benefit continues to cause problems across Scotland in limiting the access of younger single people to the private rented sector and is viewed as undermining the ability of Housing Options teams to use the private rented sector as a means to prevent or resolve homelessness.

The proposed extension of the Shared Accommodation Rate to social tenants under 35 is a particular concern in Scotland given the high proportion of all households accepted as statutorily homeless that this change will potentially affect.

Homelessness in Northern Ireland

The Homelessness Monitor is a longitudinal study, commissioned by Crisis and is funded by Crisis and the Joseph Rowntree Foundation, providing an independent analysis of the homelessness impacts of recent economic and policy developments in the United Kingdom. It considers both the consequences of the post-2007 economic and housing market recession, and the subsequent recovery, and also the impact of policy changes. 

The first English monitor was released in 2011 and these pages document the change in homelessness trends since this baseline data was undertaken in England, Scotland, Wales and Northern Ireland. Statutory homelessness policy has diverged significantly across the UK since devolution in 1999 and is a contributing factor in explaining the variation in the levels and patterns of homelessness.

The research is carried out by Suzanne Fitzpatrick, Glen Bramley and Beth Watts at Heriot-Watt University, Steve Wilcox former professor at the University of York, and Hal Pawson at the University of New South Wales.

The following data is based on the latest published Homelessness Monitor in each country – England (2017), Wales (2015), Scotland (2015) and Northern Ireland (2016). For full research findings please download the monitor reports in the knowledge hub library.

Rough sleeping levels 

There are no regular street count data or other trend data published on rough sleeping in Northern Ireland. However, a recent 'street needs audit' indicates that rates of visible rough sleeping remain low in Belfast city centre, average six people per night.

Statutory homelessness levels

In 2015/16 18,600 households presented as homeless in Northern Ireland. Well over half of these at 11,200 were judged as ‘Full Duty Applicants’. Full duty applicants are those who have passed the four statutory tests – they are homeless, in priority need, eligible for assistance and unintentionally homeless.

The graph below shows that the number of homeless presentations have remained at fairly stable levels throughout the past decade but the number of households being given a ‘Full Duty’ has risen year on year since 2012/13. In contrast, the number of homelessness applications that did not attract Full Duty status.
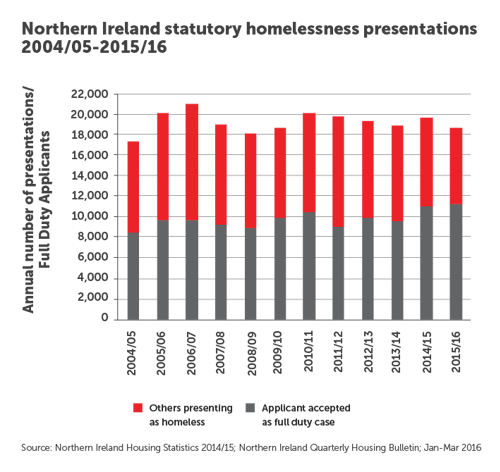
In contrast, the number of homelessness applications that did not attract Full Duty status have fallen sharply. This can be explained by changing local authority practices and the piloting of the Housing Solutions model which focus on informal actions to prevent homelessness.

Causes of homelessness

The chart below shows the ‘reason for homelessness’ among those applicants with a Full Duty. These categories are unique to Northern Ireland making comparisons with the rest of the UK limited. An important difference is the ‘accommodation not reasonable’ which includes older people subject to rehousing having been judged to no longer be able to manage a family home.

If this group are discounted from overall ‘Full Duty’ statistics the growth in homeless approaches would be halved to 6%. An important difference is the ‘accommodation not reasonable’ which includes older people subject to rehousing having been judged to no longer be able to manage a family home. If this group are discounted from overall ‘Full Duty’ statistics the growth in homeless approaches would be halved to 6%.

A rise of 12% for ‘loss of rented accommodation’ in the last three years is modest in comparison to 250% rise over the last five years in England, which is likely to reflect the milder impact of the Local Housing Regime in Northern Ireland.

Hidden homelessness

Hidden homelessness refers to people who are considered homeless but whose situation is not visible either on the streets or in official statistics. This includes sofa surfers and people involuntarily sharing with others on a long term basis.  Using household surveys, it is possible to build a picture of hidden homelessness in terms of concealed households, those sharing accommodation and overcrowded households.

Using household surveys, it is possible to build a picture of hidden homelessness in terms of concealed households, those sharing accommodation and overcrowded households.

There has been a small overall fall in the number of concealed potential households since 2010. There are an estimated 76,000 to 136,000 adults currently living as concealed households in Northern Ireland who would prefer to live independently. After a long history of decline shared accommodation has increased markedly in Northern Ireland, accounting for 4.4% of all households in 2015.

After a long history of decline shared accommodation has increased markedly in Northern Ireland, accounting for 4.4% of all households in 2015.

Northern Irish economic growth

In the seven years since the credit crunch the Northern Irish economy has recovered much more slowly than in the rest of the UK, as illustrated in the graph below. Unemployment and economic inactivity among the working age population are notably higher in Northern Ireland at 32% compared to the rest of the UK at 27%. 
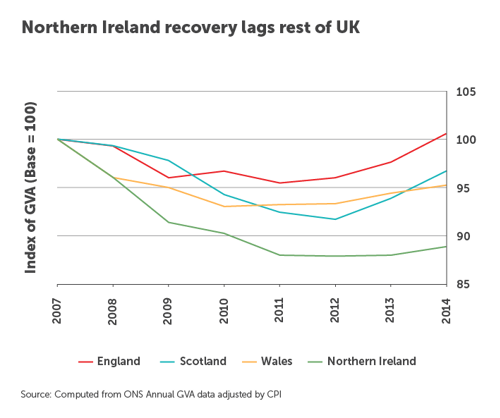
Public sector jobs account for a much higher proportion of total employment then in the UK making workers particularly vulnerable to public expenditure cuts. Northern Ireland is also characterised by low levels of pay, and household incomes, compared to the rest of the UK with average fulltime earnings 17% lower than in the rest of the UK.

Housing market affordability

The Northern Irish housing market has over the last two decades followed a distinctive pathway compared to the rest of the UK. It is more closely linked to the Irish economy and housing market. As the graph shows in

As the graph shows in 2007 the market went from one of the most affordable in the UK to being one of the least and briefly was even less affordable than London. As in Ireland, the subsequent fall in house prices was also far more severe than the across the rest of the UK. This has returned the market to more traditional levels leaving behind
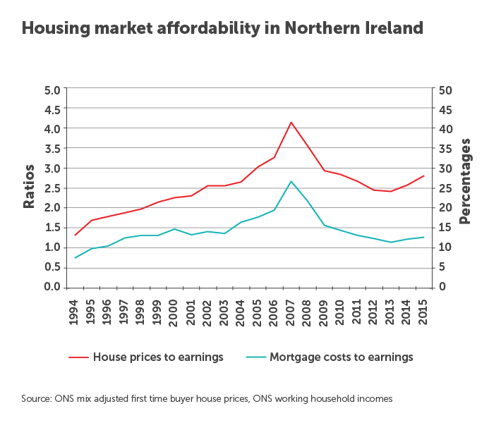
This has returned the market to more traditional levels leaving behind higher proportion of households in negative equity.

Access to home ownership has become more problematic for first time buyers, as the reduced flow of mortgage funds and regulatory pressures have drastically reduced the availability of mortgage products for those with low or no deposits. 

Private rented sector

The private rented sector has almost quadrupled in Northern Ireland over the last fourteen years. It has grown from 32,000 dwellings in 2000 to 103,000 in 2014. This is proportionally far higher than in the rest of the UK.
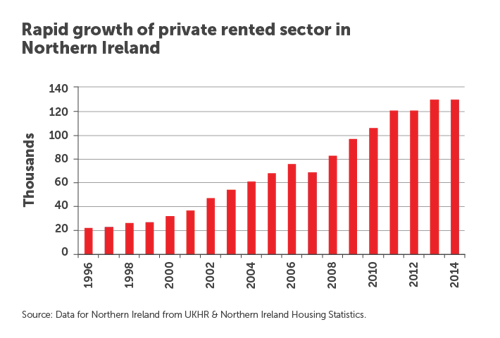
This market fulfills an important and active role in providing accommodation for households at all income levels and is consequently providing accommodation for a high proportion of all households moving in each year.

Unlike England, there has been no pronounced recent rise in the number of homeless applicants due to the loss of rented accommodation. This is likely to reflect the different impacts of welfare reform.

Social housing lettings

Northern Ireland devotes a higher proportion of its public expenditure to housing relative to the rest of the UK. Despite this Northern Ireland does not have a higher proportion of social housing when compared to the rest of the UK, as the graph below shows.
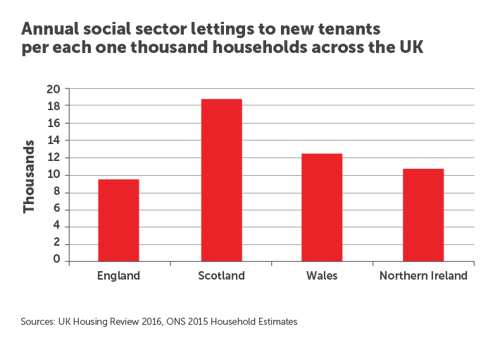
The proportion of social sector letting as part of overall housing tenure in Northern Ireland is 16% which is similar to England at 17%, whilst Scotland has the most at 24%. As in the rest of the UK new social housing is now being provided by housing associations. Yet housing associations only account for just over a quarter of the sector in Northern Ireland.

Welfare policies

The Northern Ireland Executive has is due to introduce, most of the welfare reforms now underway in Great Britain, but with some notable exceptions or modifications. An agreement was reached with the UK government to provide a funding package to enable Northern Ireland to mitigate those welfare reforms based on the recommendations of a Working Party chaired by Professor Eileen Evason. As a result both the ‘Spare Room Subsidy Limits’ and the Benefit Cap will be fully mitigated until 2020.

Reforms to the Local Housing Allowance regime in Northern Ireland were introduced on the same basis, and to the same timetable, as for the rest of the UK. There is little hard evidence on their impact, and while lower rents in Northern Ireland mean that the effects are unlikely to have been as substantial as in England, a growing gap between Local Housing Allowance rates and average rents may compound these impacts over time.

;